
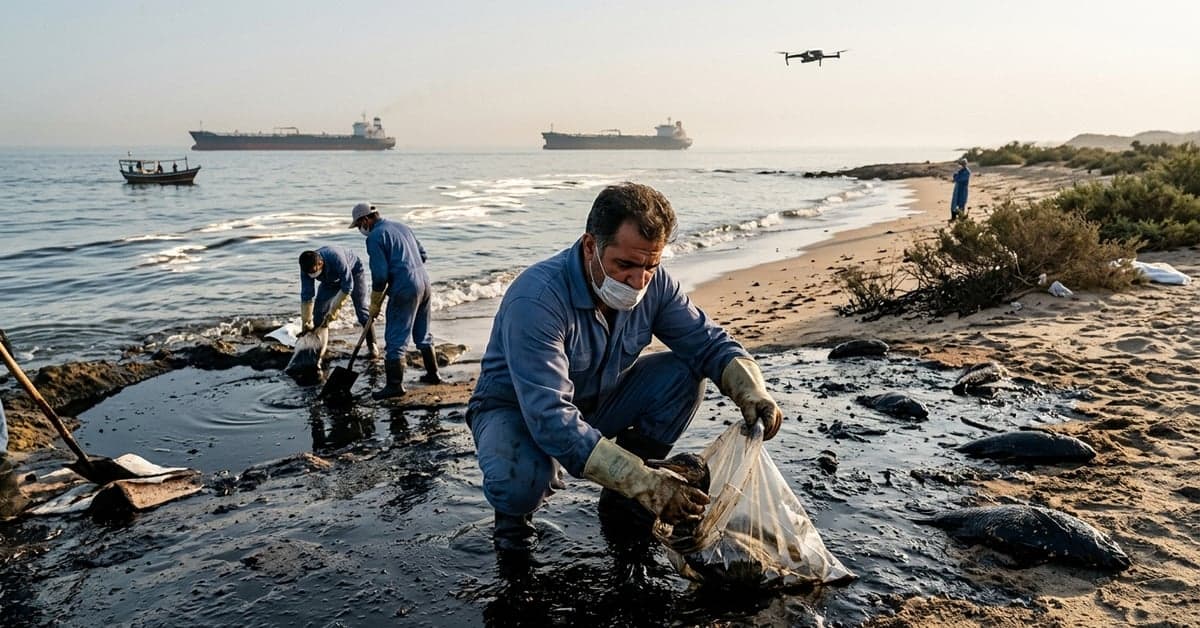
An oil slick has washed up on Iran’s coast after a ship was attacked on August 3, 2026, according to BBC Verify. In the same stretch of days, the unit documented tankers making abrupt U-turns after Houthi threats, a U.S. strike on an unladen tanker near a key export terminal, and a sharp fall in traffic on a U.S.-backed route through the Strait of Hormuz. Paired with an AI-generated image of Mojtaba Khamenei spreading online, the week’s reporting sketches a single picture: environmental damage, shipping risk, and information warfare converging around Iran.
What BBC Verify Iran coverage shows about the Gulf right now
BBC Verify reports that pollution from the August 3 attack has reached shore and threatens wildlife along Iran’s coastline. The unit cites expert assessments and satellite views to track the slick’s spread and likely impact. Separately, its ship-tracking work shows tankers reversing course after Houthi warnings, with many of those vessels bound to or from Saudi ports before turning away. The team also logged a U.S. missile strike on an unladen tanker said to be headed toward the Kharg Island terminal and a measurable drop in ships choosing a U.S.-backed Hormuz corridor after fresh attacks, based on movement data and routing patterns.
None of these data points alone tells the whole story. Together they suggest a three-front squeeze: a damaged marine environment, rerouted energy flows, and a fog of online claims. That blend matters because the Strait of Hormuz is among the world’s most sensitive oil transit lanes. The U.S. Energy Information Administration estimates roughly a fifth of global petroleum liquids typically pass through Hormuz in normal times; any sustained diversion has ripple effects on freight costs and regional insurance risk. Readers can find background on the chokepoint’s importance from the EIA’s transit chokepoints overview.
Oil, water, and wildlife: tracing the spill’s stakes
The reported slick, first tied by BBC Verify to the August 3 ship attack, threatens coastal habitats and fisheries that line the Gulf’s shallow waters. While the team has not published a complete toxicology profile, the visible spread in satellite imagery is enough to raise flags for mangroves, sea turtles, and seabirds common to the region. Recovery in similar spills depends on oil type, currents, and temperature. The U.S. National Oceanic and Atmospheric Administration documents how even weathered oil can foul shorelines and smother benthic life, sometimes for months. Their primer on oil spill impacts provides useful context for what rehabilitation might entail.
The core question now is duration. If the source vessel continues to leak, the spill risk turns from incident to ongoing discharge. BBC Verify’s use of repeat-pass satellite views makes it possible to judge that trajectory without relying on official tallies that may lag. That approach, seen in this week’s coverage, is a rarity in daily news and helps ground public debate in observed change over time.
Shipping shifts and why they matter for energy security
BBC Verify’s ship-tracking analysis adds a second thread: behavior change at sea. Their report shows tankers executing sharp U-turns after Houthi threats and a broad decline in ships using a U.S.-backed Hormuz route after new strikes. This is how risk expresses itself before prices move: captains and charterers redirect on the basis of threat perception. Those course corrections carry costs—extra days under way, higher fuel burn, different port calls—and they compound fast when many vessels follow suit.
The mechanics of this kind of reporting rest on AIS, the Automatic Identification System that broadcasts a ship’s position, speed, and heading. BBC Verify’s conclusions align with what AIS can reveal in near real time, from sudden turns to loitering near chokepoints. For readers unfamiliar with AIS, the International Maritime Organization’s explainer outlines how it works and why regulators require it. When a newsroom pairs AIS with open satellite imagery, evasive routing and traffic drops become observable facts rather than political claims.
Information warfare: the AI-generated Khamenei image and the Pickaxe claim
BBC Verify also flagged an AI-generated image of Mojtaba Khamenei, noting he has not appeared in public since March but fabricated pictures of him continue to circulate. In a separate piece, the team analyzed “Pickaxe Mountain” in Iran after former President Donald Trump said he wanted to bomb it, using experts and satellite imagery to assess what the site appears to be and what a strike might do. Those two items complement the maritime reports. They show how visual claims—some synthetic, some cherry-picked—shape perceptions of capability and intent.
Digital provenance efforts, like the C2PA content credentials standard, aim to make such fakes easier to spot at scale. But this week’s examples underscore a near-term reality: rigorous media verification still depends on human judgment, technical forensics, and clear sourcing. That’s the space BBC Verify occupies, and the reason its Iran file is drawing attention beyond media circles.
How the BBC Verify Iran file is different—and what to watch next
Two things stand out across the BBC Verify Iran reporting. First, the cadence. The unit stitched together environmental, maritime, and information signals within days, which let readers see cause and effect build: a strike at sea, a slick ashore, detours by tankers, and then fewer ships choosing a putatively safer path. Second, the method. These pieces are grounded in observable data—satellite pixels, AIS tracks, and image forensics—rather than anonymous briefings. That mix reduces room for spin.
What should readers track now? Three practical indicators:
- Spill persistence on subsequent satellite passes and any change in shoreline impact near key Iranian terminals.
- Tanker routing through or around Hormuz week by week, especially any shift in Saudi-bound voyages.
- Volume and spread of synthetic images tied to Iranian figures, which often spike around escalatory statements.
Each is measurable, and each will feed back into risk pricing. The EIA’s Hormuz data offers a ceiling for how far flows can compress before inventories bite, while shipping behavior offers an early read on where sentiment sits. On the information side, the share of debunked images versus verified visuals gives a rough gauge of narrative pressure.
Why this synthesis matters beyond the Gulf
The week’s BBC Verify Iran findings double as a template for covering contested events anywhere. Environmental harm is documented through repeat imagery rather than estimates alone. Maritime risk is inferred from behavior before market data catches up. Disinformation is addressed through transparent forensics instead of hand-waving. That recipe won’t settle policy disputes, but it does narrow the range of plausible claims.
Readers who want to check the raw material can follow the unit’s Iran updates on the BBC site and compare them against independent references such as the EIA and NOAA. The approach may also help local newsrooms: AIS and open satellite sources are accessible, and so are basic authenticity checks on suspicious images. As those tools spread, the hope is fewer headlines shaped by rumor and more by what the sensors show.
In a week when rumors and fuel flows collided, the BBC Verify Iran coverage delivered something rarer than a viral clip: a stitched view of how a conflict touches beaches, shipping lanes, and screens—sometimes all at once. For more on this, see bloomberg.com and nytimes.com.