
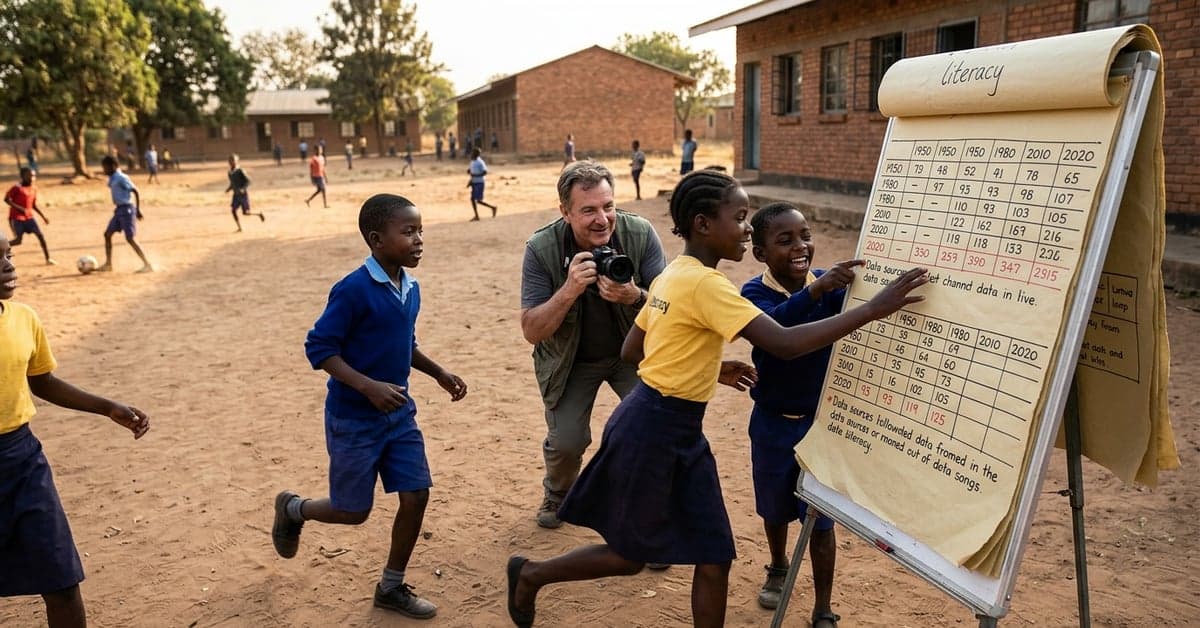
For most of human history, only a tiny elite could read and write. That stark baseline frames the new long-run view assembled by Our World in Data, which combines historical records and modern surveys into a single, comparable series. The Our World in Data literacy work makes one thing plain: mass literacy is a recent achievement, and its coverage is still uneven.
What the Our World in Data literacy series includes
According to Our World in Data, the team reviewed the strengths and weaknesses of available measures, then stitched together estimates from historical research and recent UNESCO Institute for Statistics sources into a continuous timeline. The result is a charted series that tracks the share of people able to read and write across countries and centuries, rather than treating each era and dataset as isolated snapshots.
The project emphasizes a simple but powerful question: when did literacy become a widespread skill? By collating long-run estimates, the series shows how literacy expanded with schooling in the last few generations, after centuries in which rates barely moved. That view is hard to see in year-by-year reports alone, which is why a consolidated baseline matters.
Method differences still matter. Some estimates rely on self-reports or census questions, while others use direct assessments. Our World in Data flags these caveats in its documentation and aligns sources as much as possible so that the big picture holds without erasing uncertainty.
Why a stitched timeline changes policy debates
The Our World in Data literacy timeline reframes a debate that often defaults to enrollment counts. Years in school don’t automatically translate into reading fluency. By focusing on the skill itself, the series highlights where decades of access gains have not yet produced strong reading outcomes. That distinction should shape how ministries and donors prioritize early-grade instruction, teacher support, and adult programs.
It also clarifies progress. The rise from elite literacy to majority coverage within a few generations is one of the fastest social shifts in recorded data. That historical context matters for expectations: fast gains are possible, but they tend to arrive when measurement, teacher training, and curriculum line up with ambitious national goals.
Comparability helps planning too. Governments comparing themselves only to economic peers can miss nearer, practical models. A harmonized series lets planners benchmark against countries that started at similar literacy levels but accelerated faster through targeted reading interventions and basic materials provision.
Hidden gaps behind today’s high rates
Even where headline rates look high, gaps remain. UNESCO’s indicators underscore that “literate” often means being able to read a short, simple statement. That threshold is not the same as functional proficiency needed to learn science, follow health guidance, or manage finance. The Our World in Data literacy view, read alongside World Bank indicators and student assessments, cautions against declaring victory too soon.
Student testing backs this up. International assessments like OECD PISA show that reading proficiency varies widely even among countries with similar adult literacy rates. That divergence suggests that adult self-reporting and census-based measures can mask quality problems in schooling, especially where promotion policies move students up grades without securing basic decoding and comprehension.
Adult literacy trends add another wrinkle. In many countries, literacy rose first among younger cohorts, then spilled over into adult education. Where adult programs lagged, intergenerational effects persisted: parents who struggle to read find it harder to support children’s literacy at home. Aligning school reforms with adult basic education can close that loop faster.
How the data should guide the next push
The clearest lesson from the Our World in Data literacy series is to focus on measurement and instruction, not just access. Three steps stand out.
- Require regular, comparable early-grade reading checks and publish the results in formats that line up with national targets.
- Prioritize teacher support that targets phonics, vocabulary, and comprehension with daily practice and simple, decodable texts.
- Back adult literacy offerings that use flexible schedules and mobile-friendly materials to raise household reading capacity.
Better data will not fix instruction by itself. But without a clear, long-run baseline and consistent checks, reforms chase anecdotes. A stitched series, like the one Our World in Data built, makes it harder to move goalposts or discount slowdowns.
What to watch in the next edition of the series
Two fronts deserve attention as the Our World in Data literacy work evolves. First, reconciling adult literacy estimates with learning outcomes among 10- and 15-year-olds would help policymakers see where today’s classrooms are setting tomorrow’s adult rates. Second, expanding metadata on survey methods—who was tested, how, and in what language—would make cross-country comparisons fairer and more actionable.
Expect more scrutiny of subnational patterns too. National averages can hide stubborn regional disparities. As more countries release microdata, a future iteration could surface rural-urban gaps and gender splits within the same long-run frame, without breaking comparability.
Mass literacy changed the arc of opportunity within living memory. The Our World in Data literacy timeline shows how quickly that change arrived—and where it stalled. The next gains will come from treating reading as the outcome to beat, measuring it cleanly, and funding what moves it. For more on this, see bloomberg.com and nytimes.com.
Related reading: Hugging Face • Fine-Tuning • Open Source AI